
Suivi de performances
Le jumeau numérique pour simuler les opérations de vos batteries
Notre tableau de bord interactif vous permet de configurer un jumeau numérique de batterie standalone ou co-localisée afin d’évaluer de façon précise son potentiel à partir de données réelles.
Les opérations historiques sont calculées en rejouant l’optimisation de votre batterie à partir de prévisions disponibles à date, et le revenu net est calculé sur la base des prix réalisés.
Nous l’avons développé et validé à partir de batteries en opération, les simulations correspondent aux factures au centime près. La simulation est mise à jour quotidiennement ce qui vous permet d’analyser les dernières tendances par rapport aux prix des marchés.
Une visualisation 360
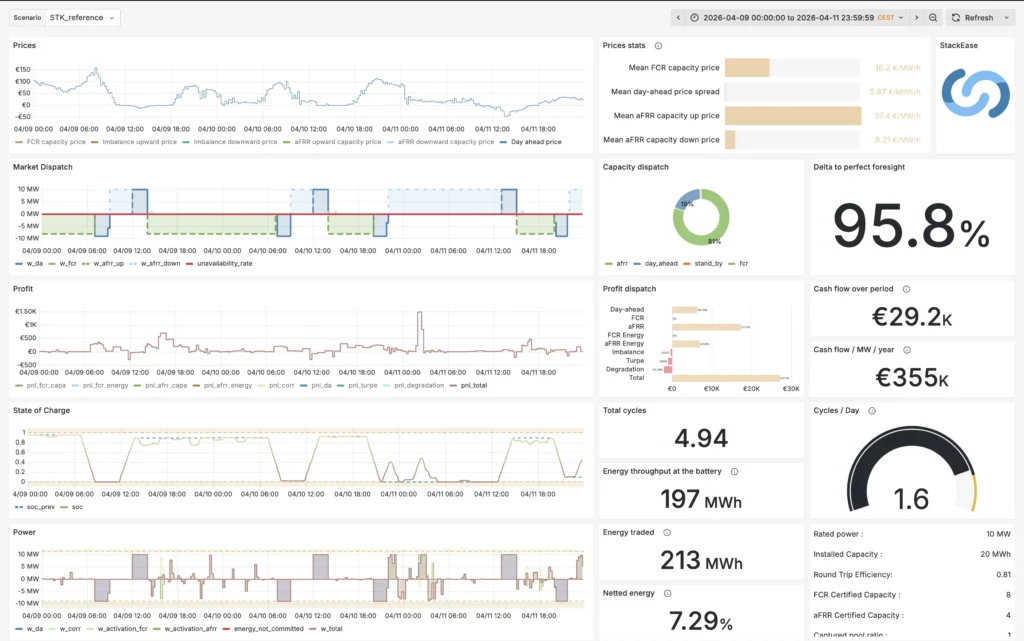
Le tableau de bord contient entre autres :
- Les prix de marché réalisés : évolution temporelle et statistiques.
- Le dispatch de la batterie : évolution temporelle, répartition sur les marchés et écart de performance à une connaissance parfaite des prix.
- Le profit généré : évolution temporelle, répartition par marchés, valeur sur la période et moyenne annuelle.
- L’état de la batterie : évolution temporelle du SoC, nombre de cycles effectués sur la période choisie et nombre moyen de cycles par jour.
- L’allocation de la puissance : évolution temporelle, énergie échangée à la batterie, énergie tradée, et énergie nettée.
Un outil d'analyse
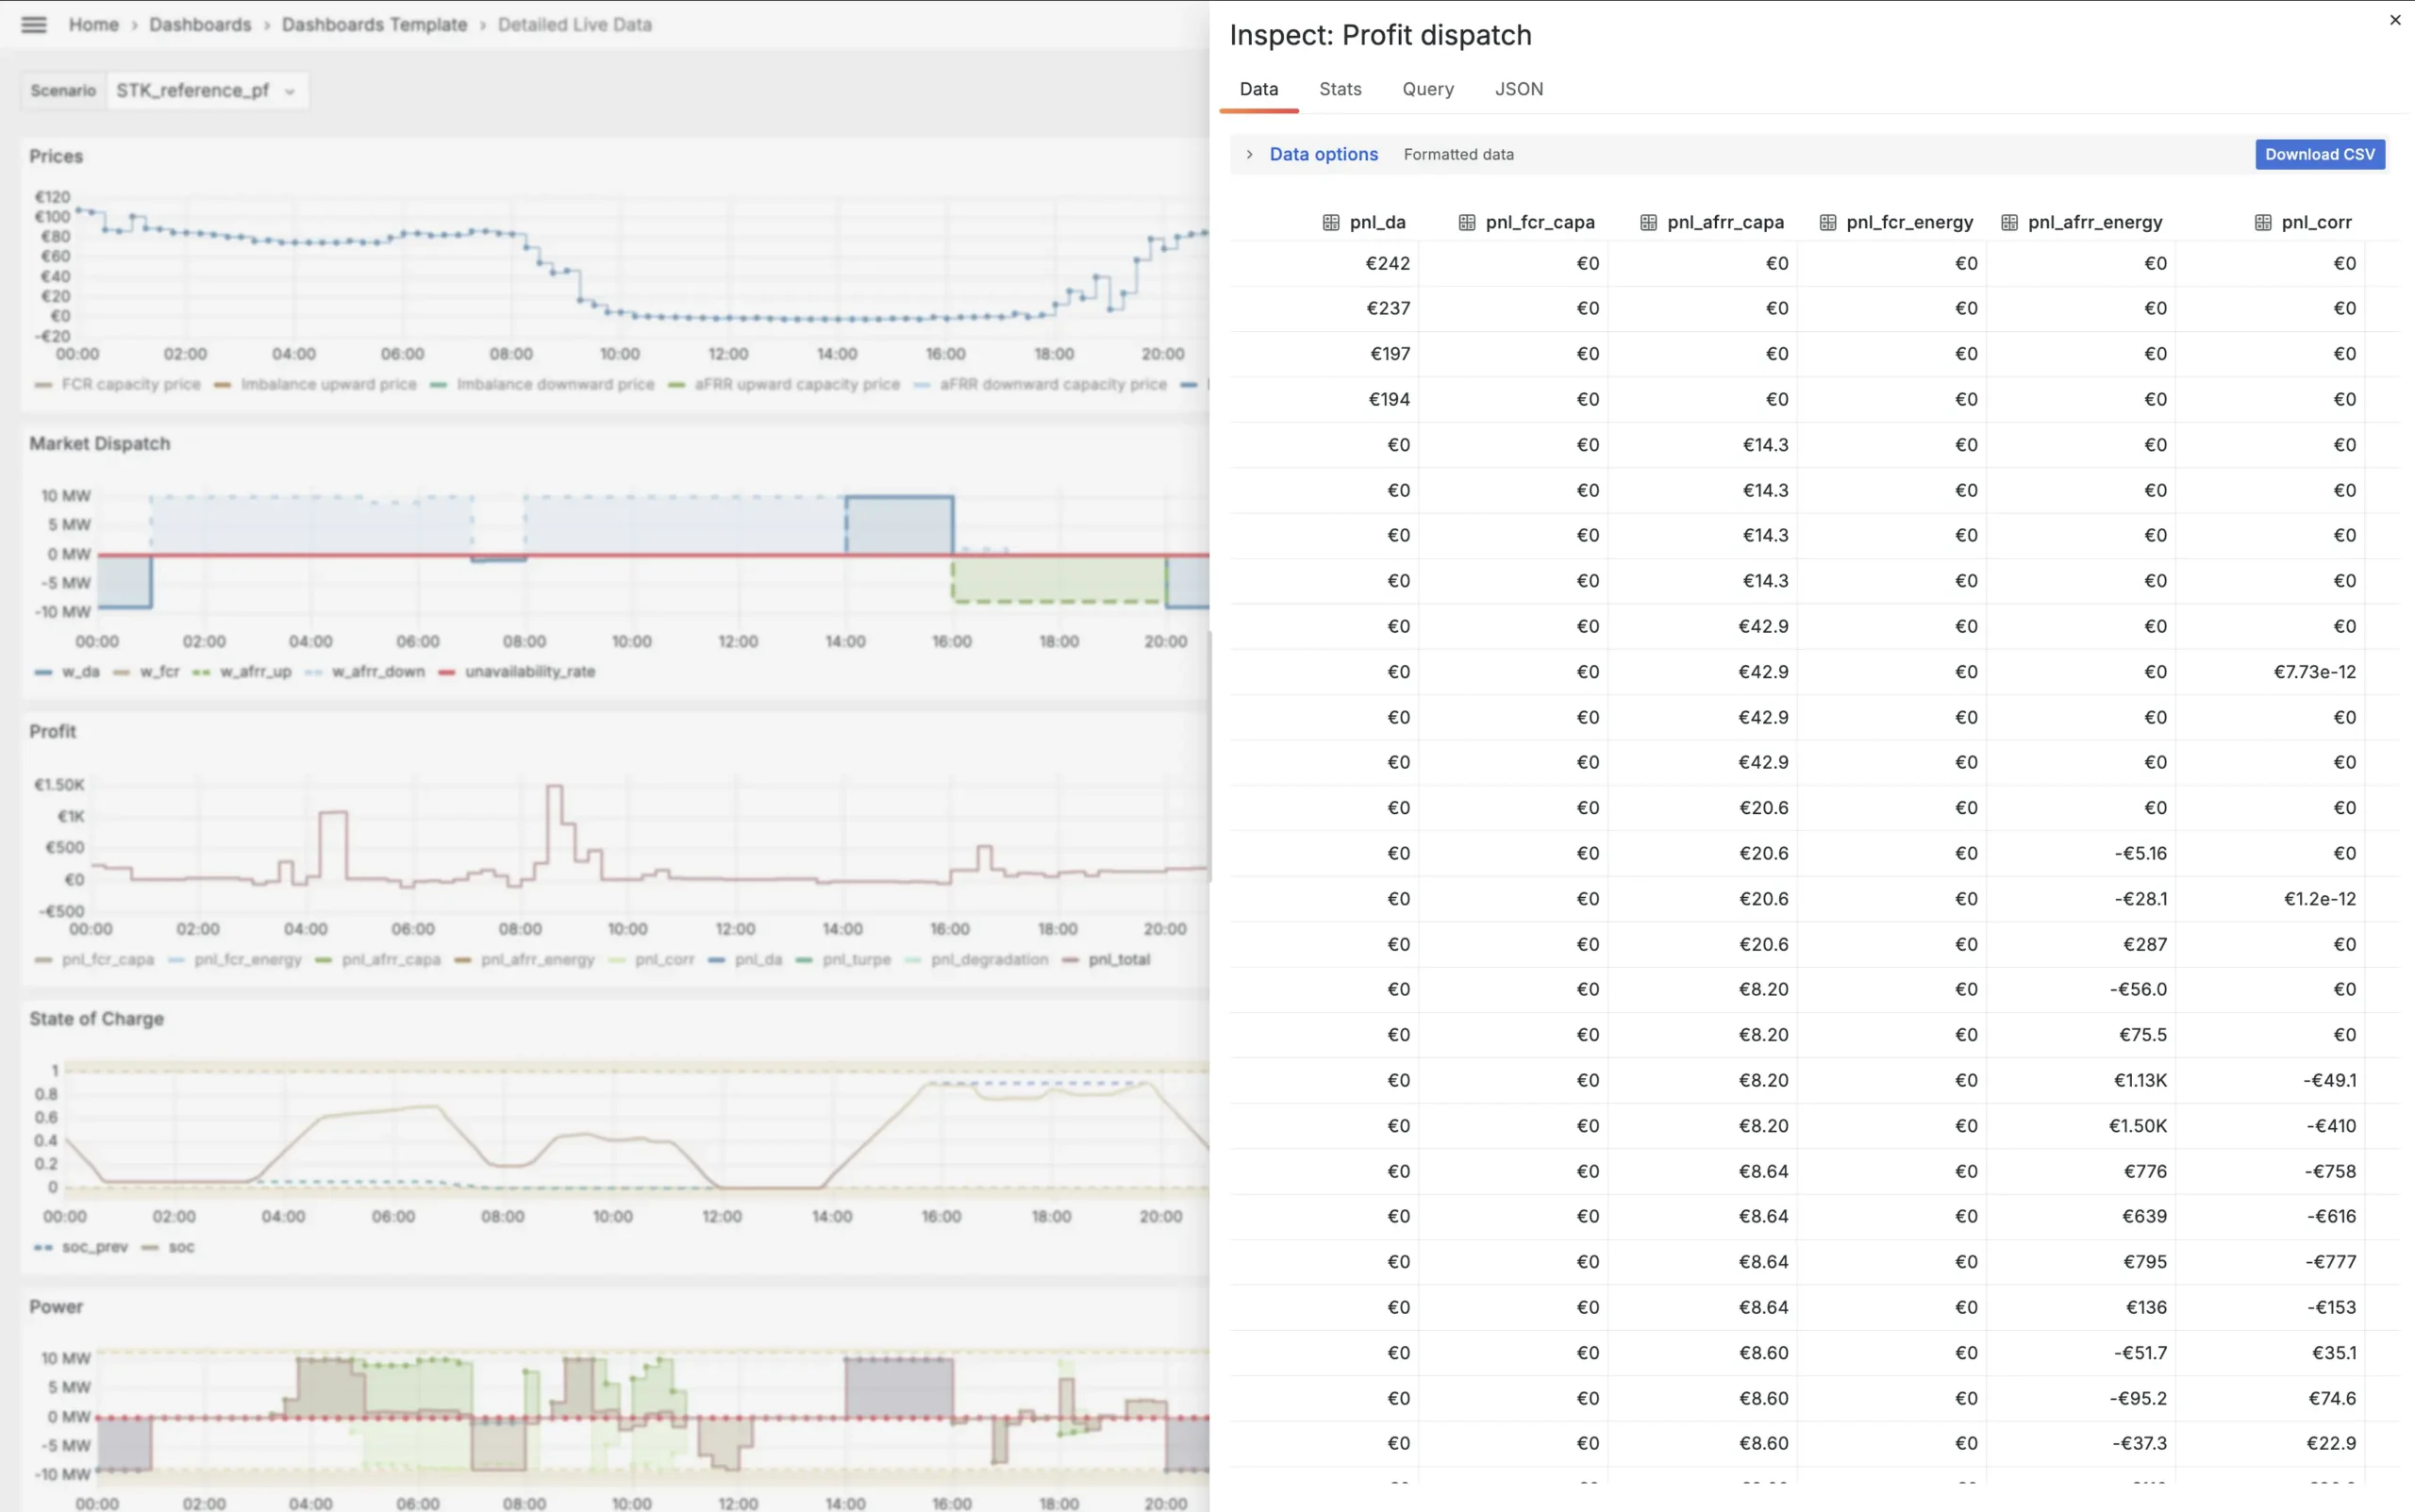
Il est possible de zoomer au pas de temps 15min sur les évolutions temporelles afin d’analyser un comportement particulier. Plusieurs simulations peuvent être instanciées afin de comparer différentes stratégies.
Les données sont facilement téléchargeables.
Les jumeaux numériques sont entièrement paramétrables
FAQ
Non, les stratégies d'agrégation sont secrètes. Par contre nous pouvons simuler différentes stratégies de valorisation, plus ou moins complexes, qui peuvent s'approcher de votre valorisation actuelle.
Les deux : on utilise les prévisions de prix pour la décision d'optimisation et les prix réalisés pour calculer le revenu net.
Oui, nous avons développé un modèle pour les sites co-localisés
Oui, on intègre les indisponibilités programmées et fortuites.